This project is the second study of coastal stratus off the Oregon coast
with the Wyoming KingAir and the Wyoming Cloud Radar. The first field experiment
took place in 1995. The sponsor for both projects is the Office of Naval
Research (ONR) through DePSCoRE grants. The 1999 field project was a collaboration
between the University of Wyoming, the Desert Research Institute, the Naval
Research Laboratory, Monterey, Oregon State University and Gerber Scientific
Inc.
Some background:
Field study:
![]() Flight
calendar and links to observations.
Flight
calendar and links to observations.
Data distribution
Preliminary data (as ascii files) for flight track and selected variables at 15 second intervals are available through this link.
Gridded data (cross-sections of latitude and longitude versus altitude) for selected parameters are included in the report for each flight day and are accessible through the flight calendar link given above.
Archive tapes (as netCDF files) of the KingAir data at 1 Hz sampling
frequency are available on CD's. The latest version was processed December
1-3, 1999. Copies will be sent to major participants. Additional copies
may be requested.
Analyses
Soundings:
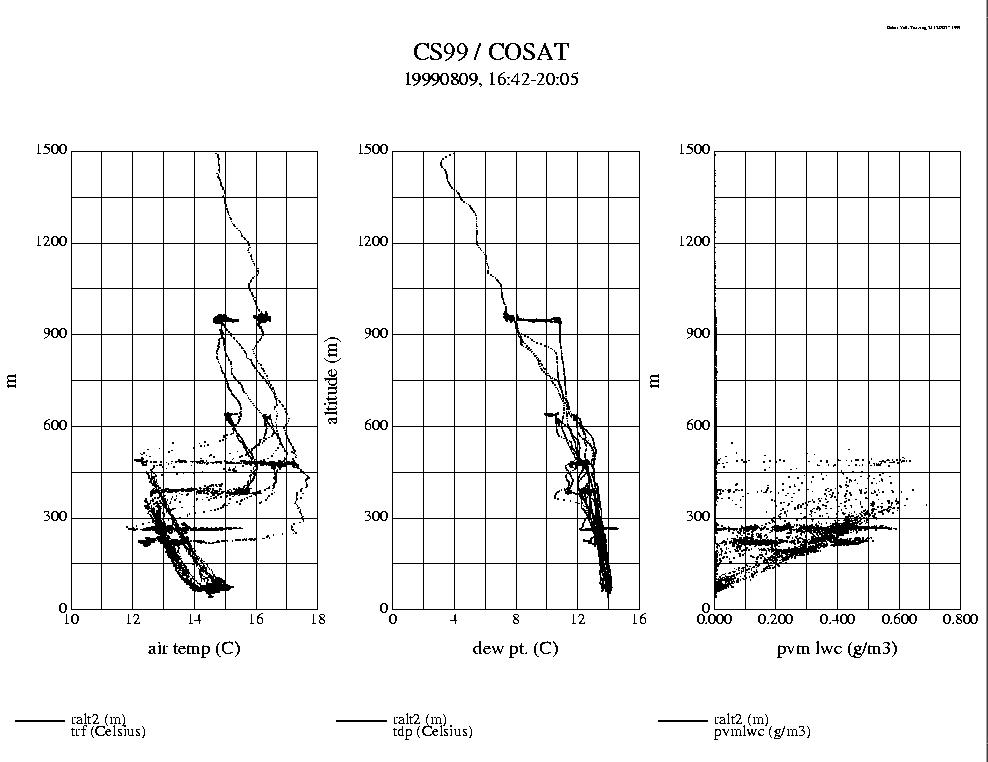
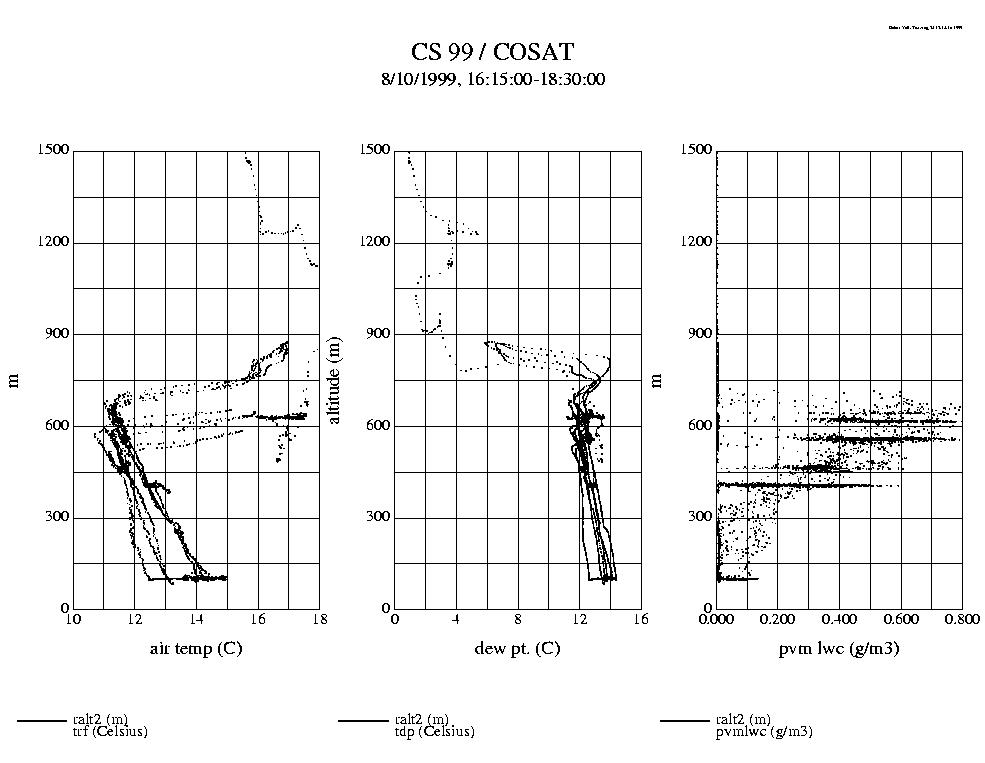
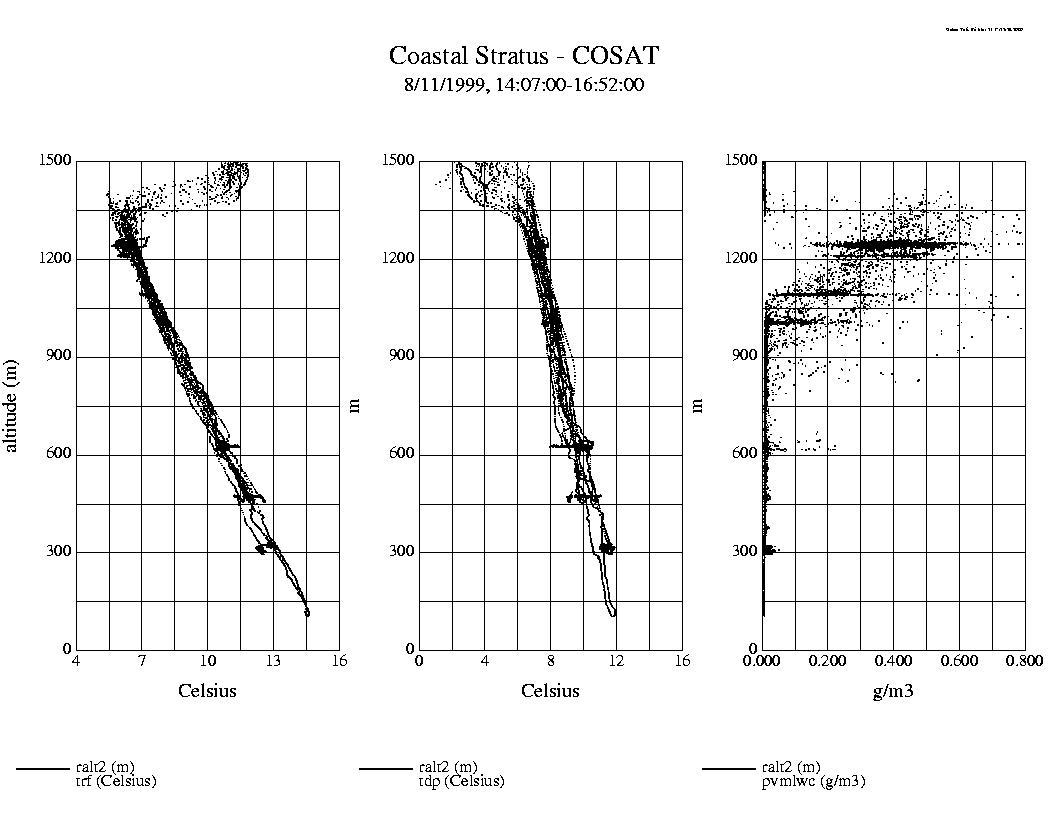
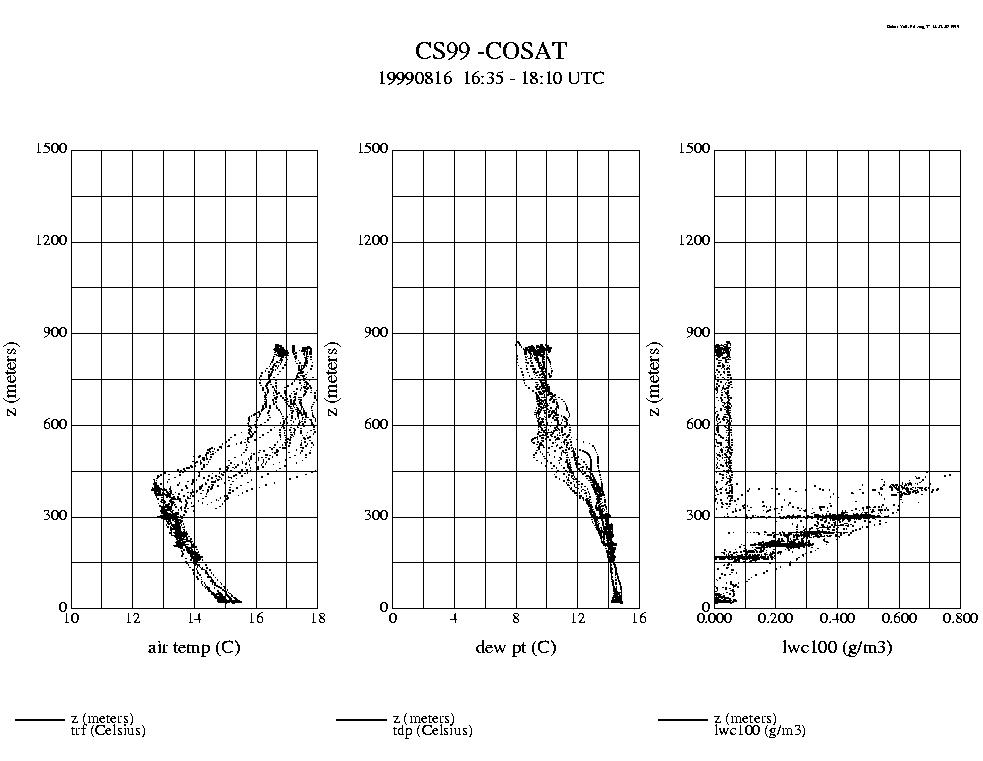
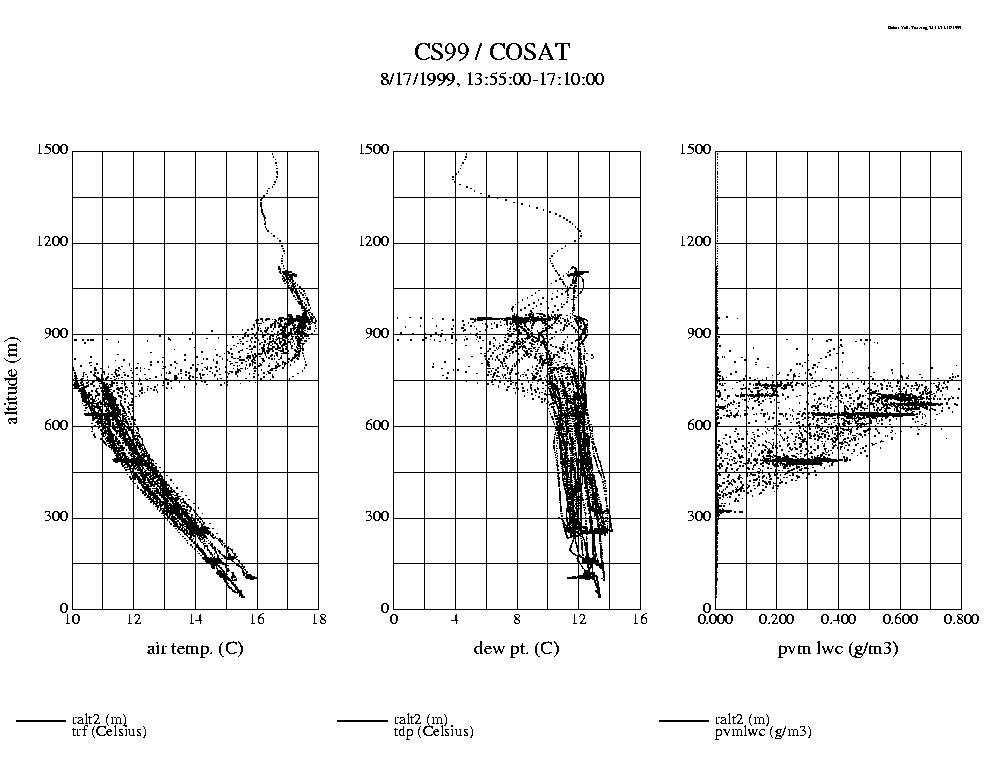
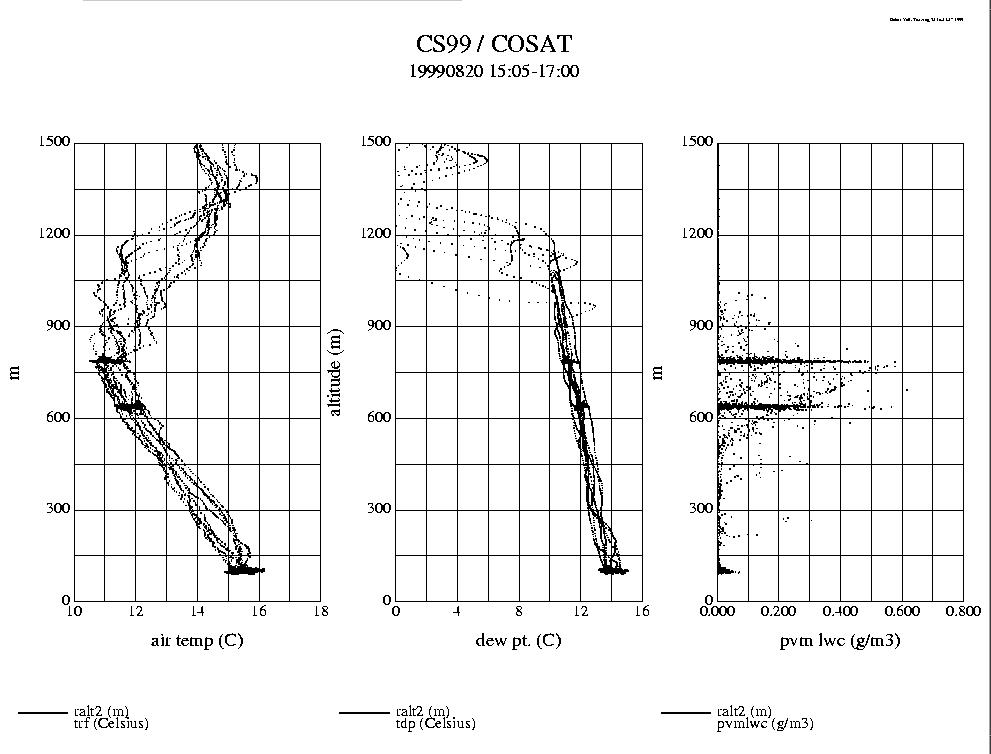
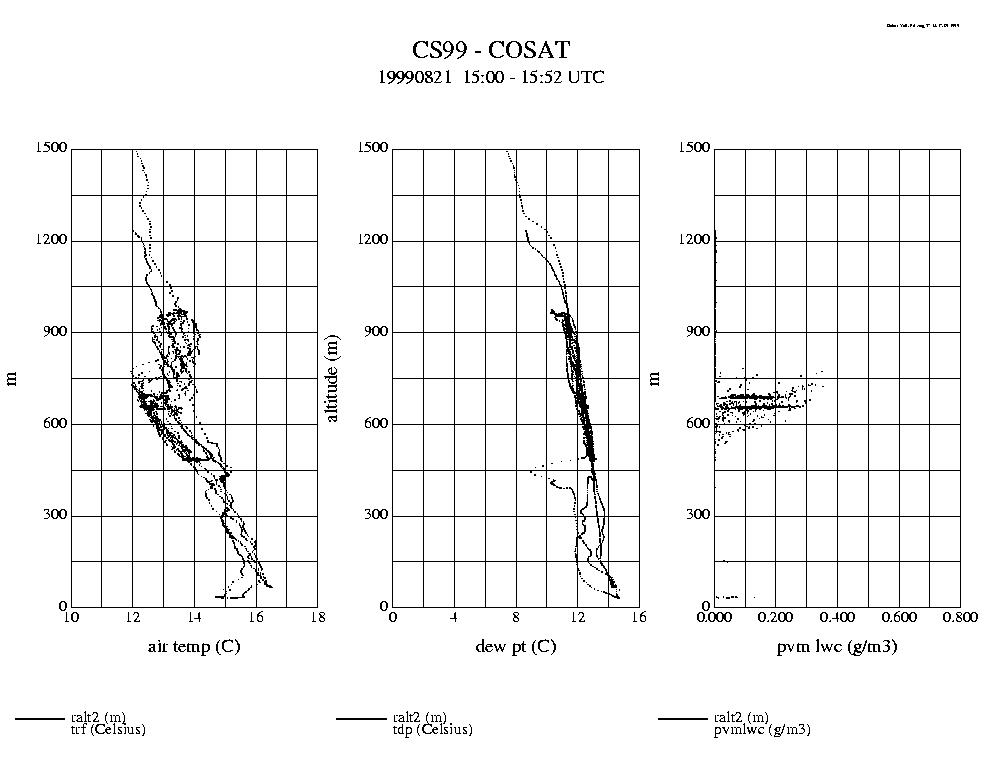
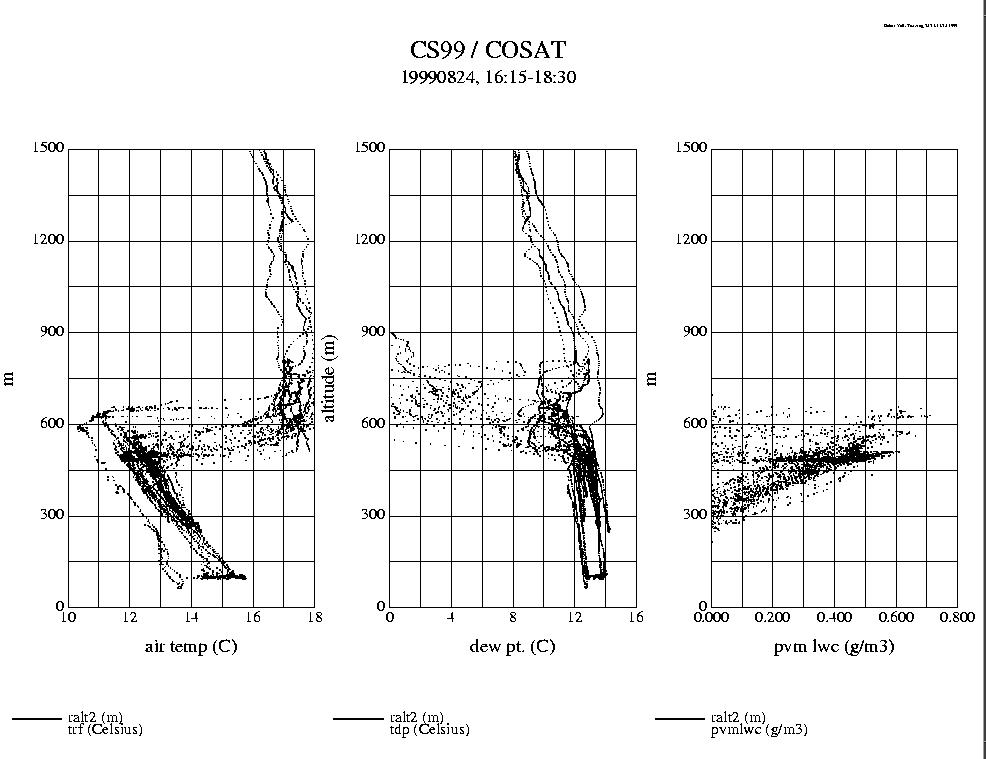
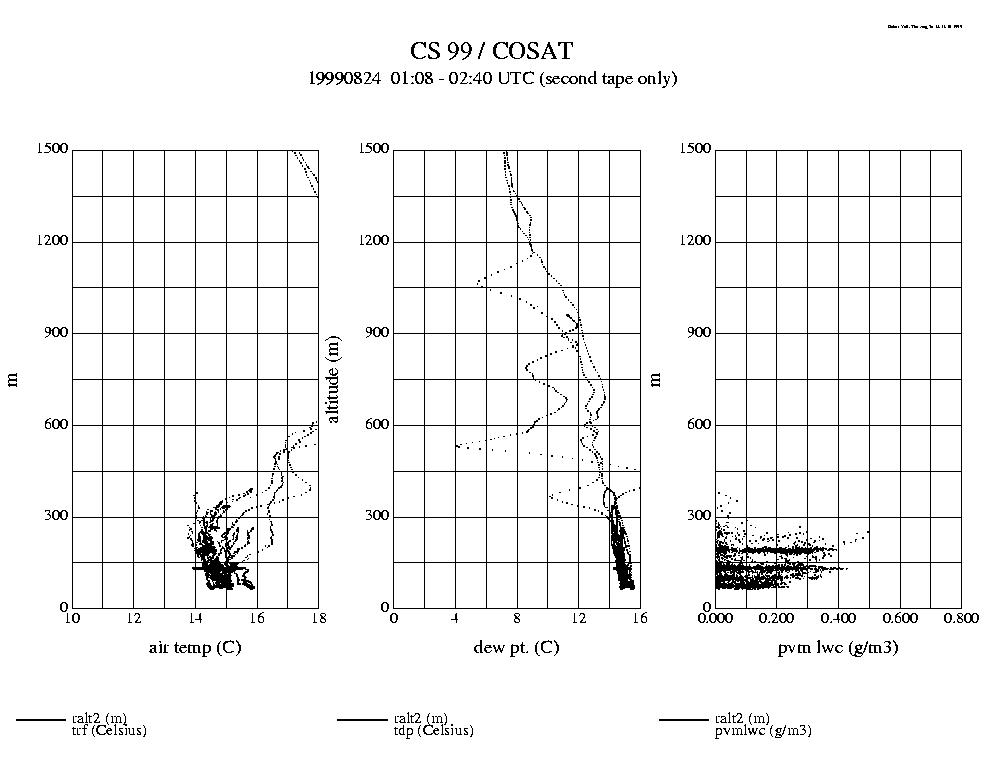
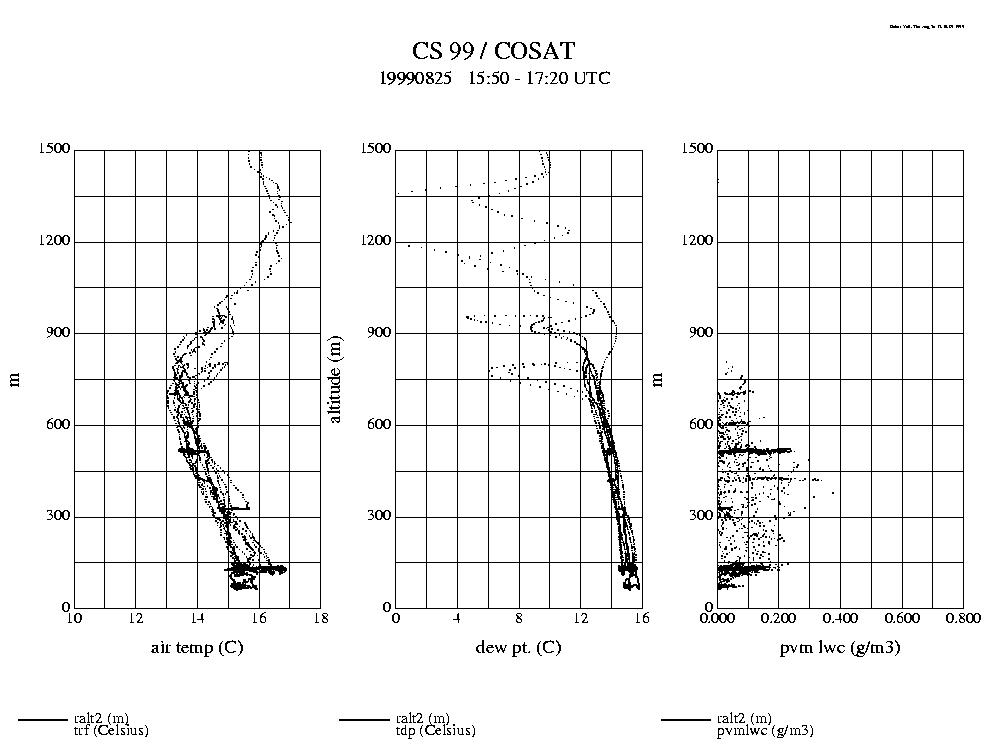
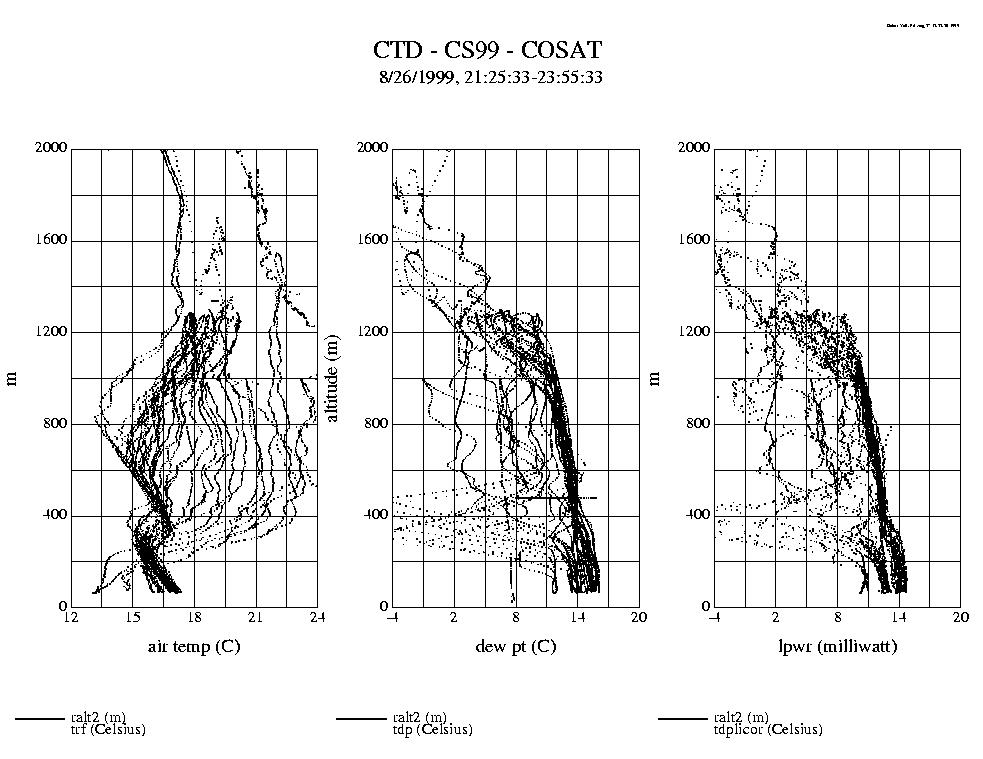
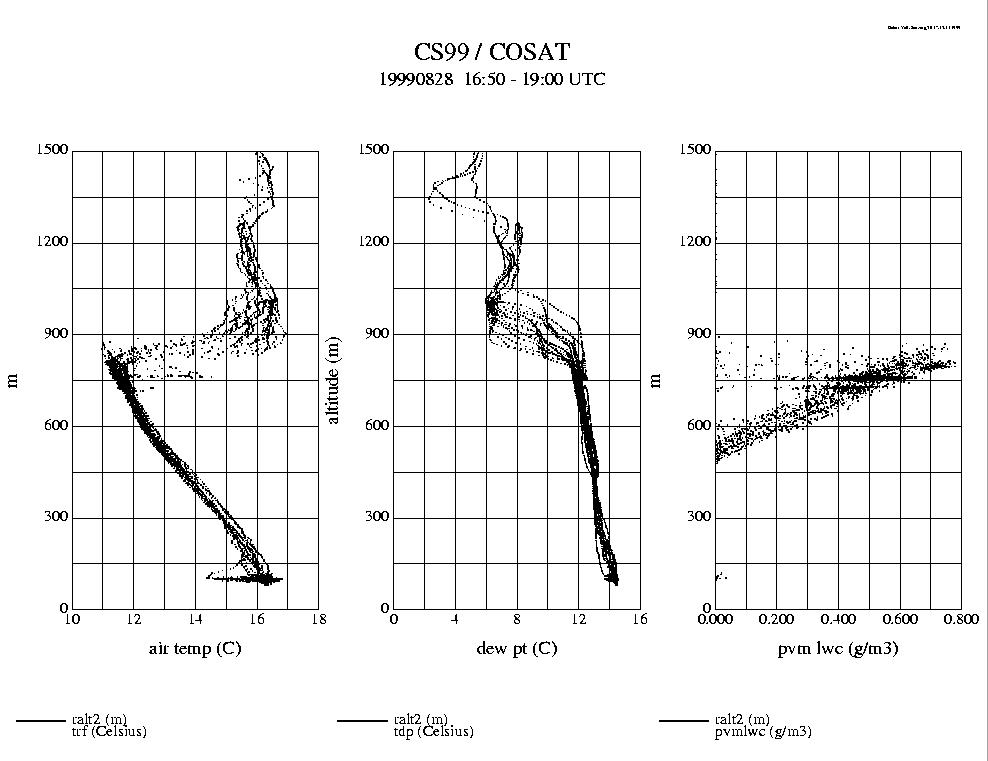
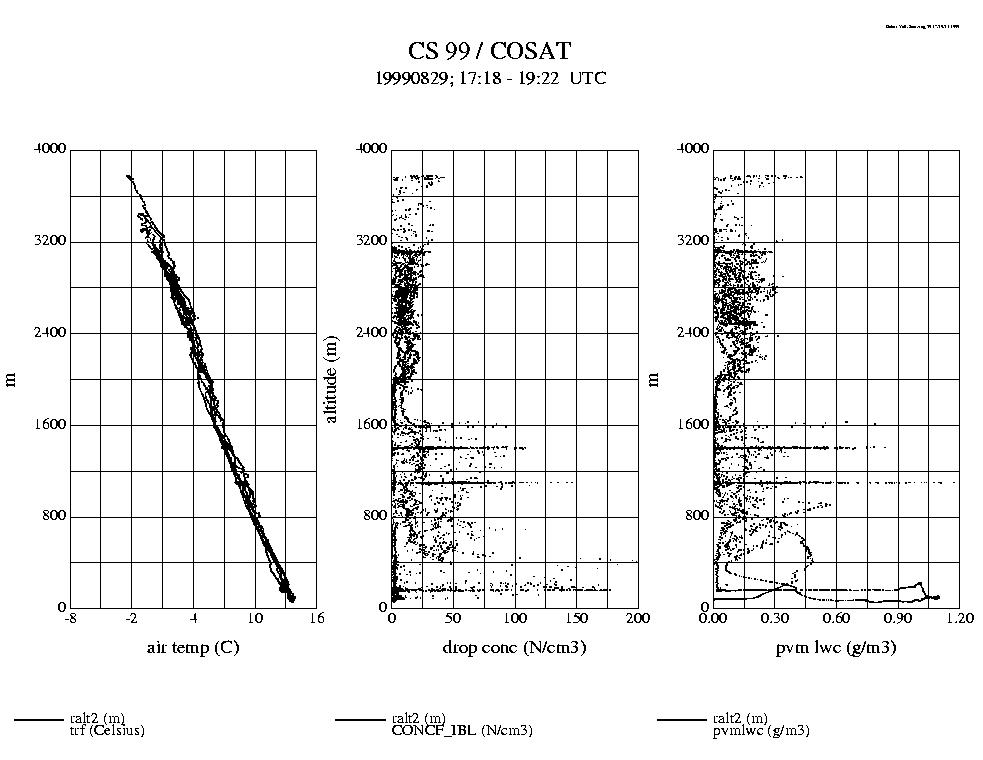
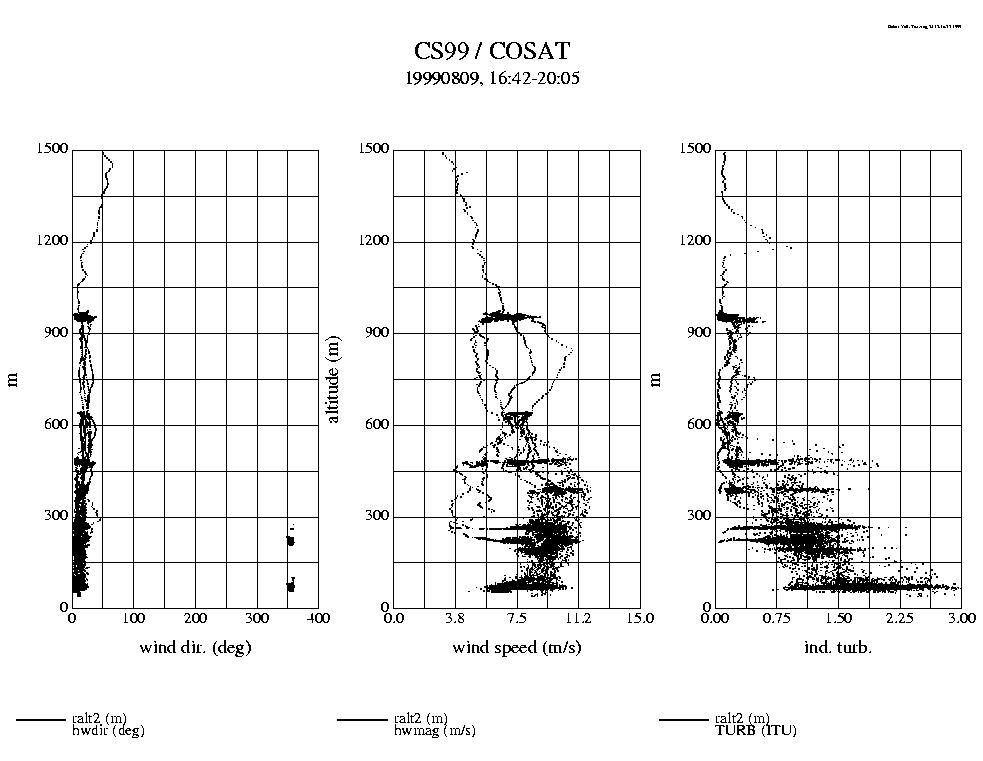
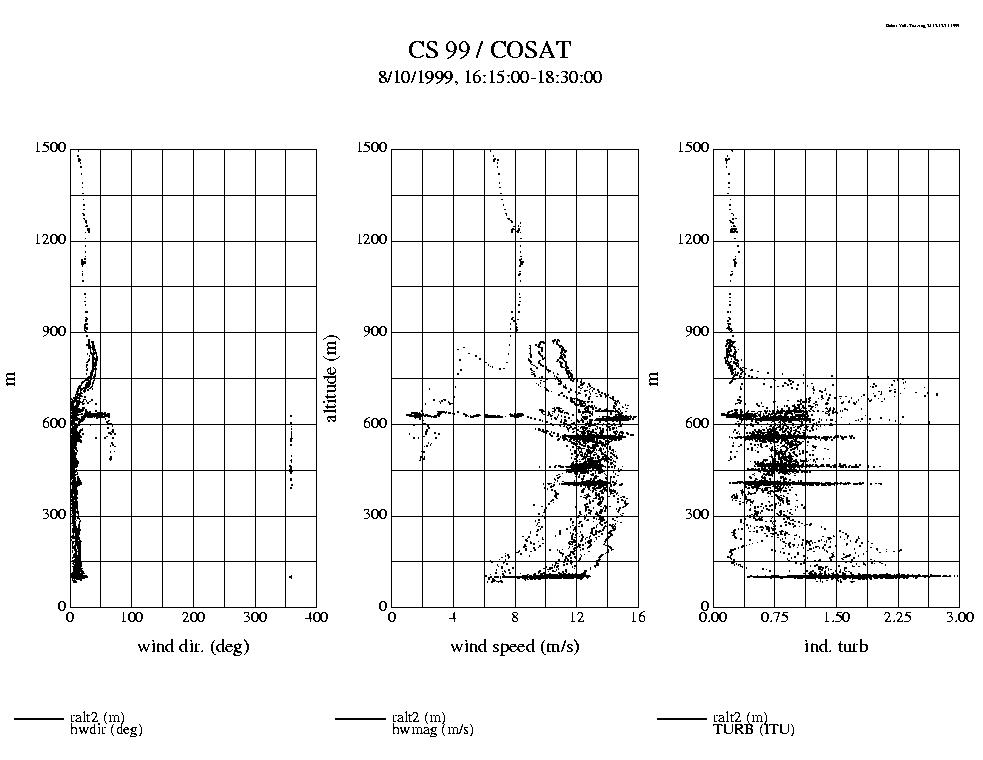
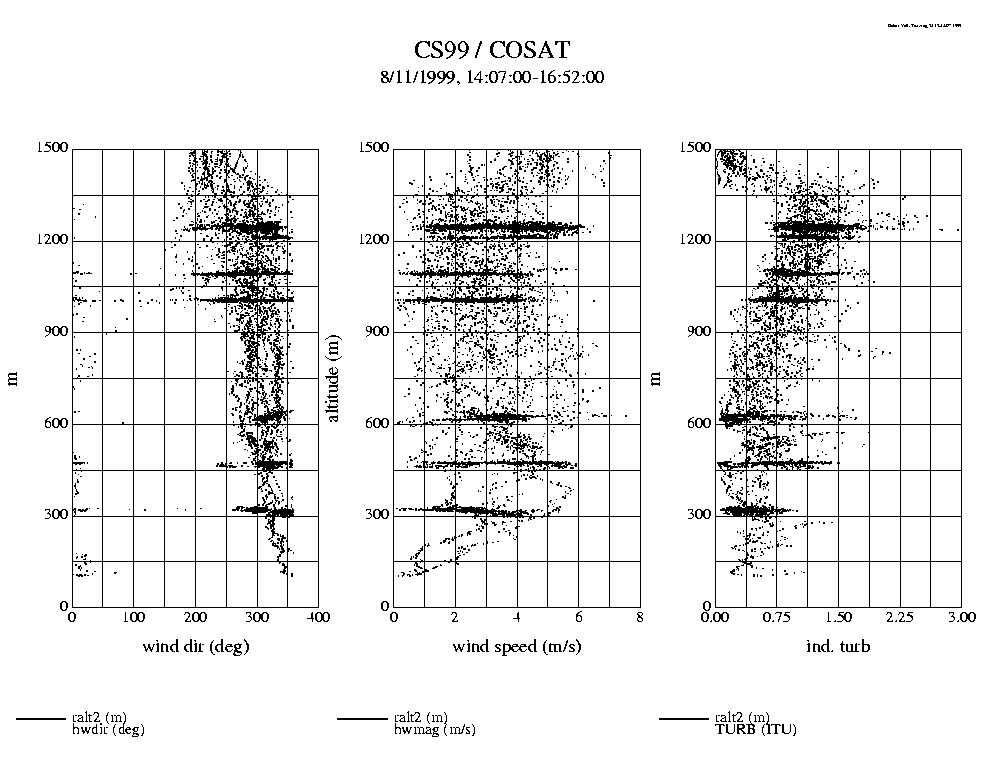
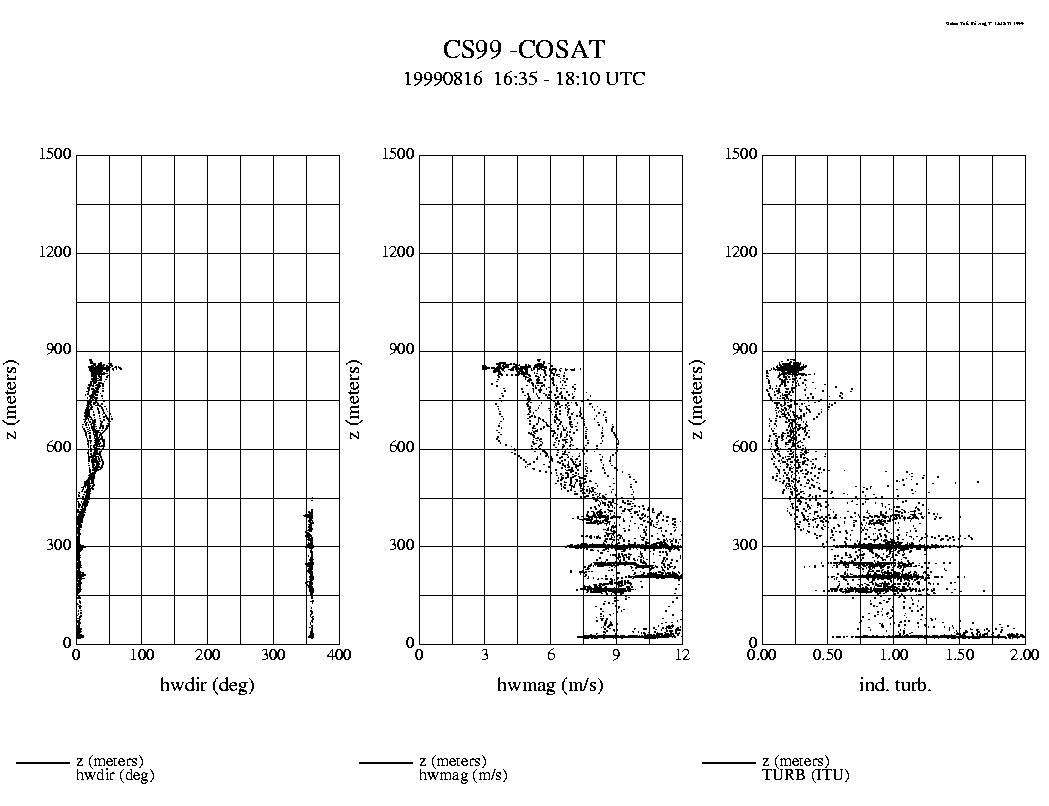
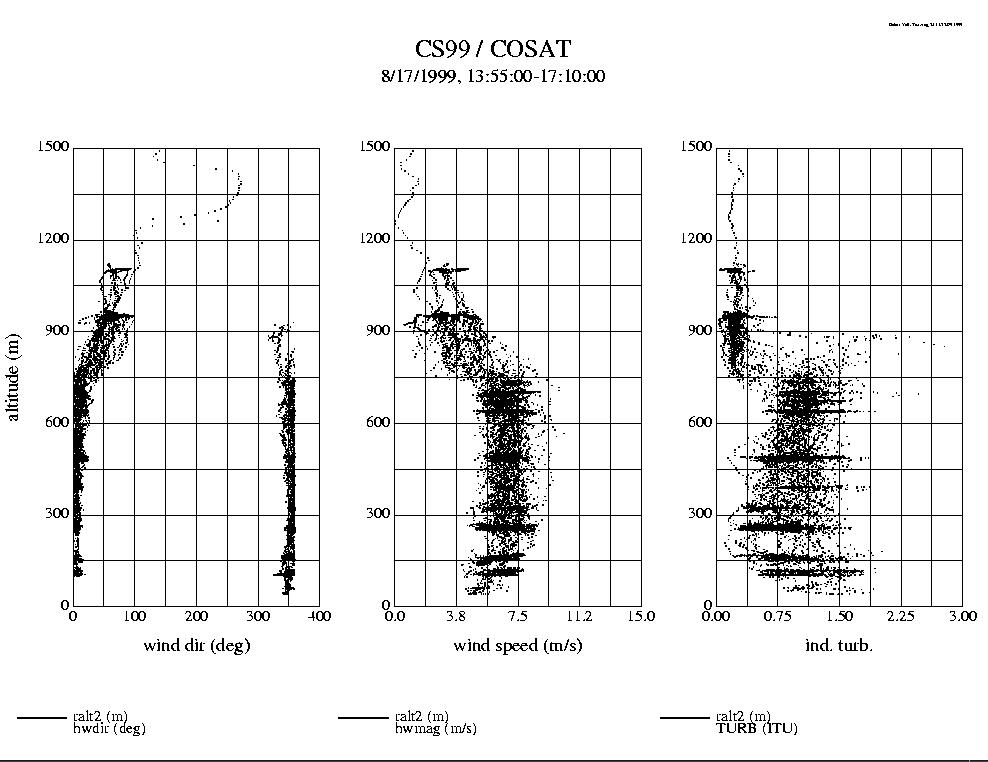
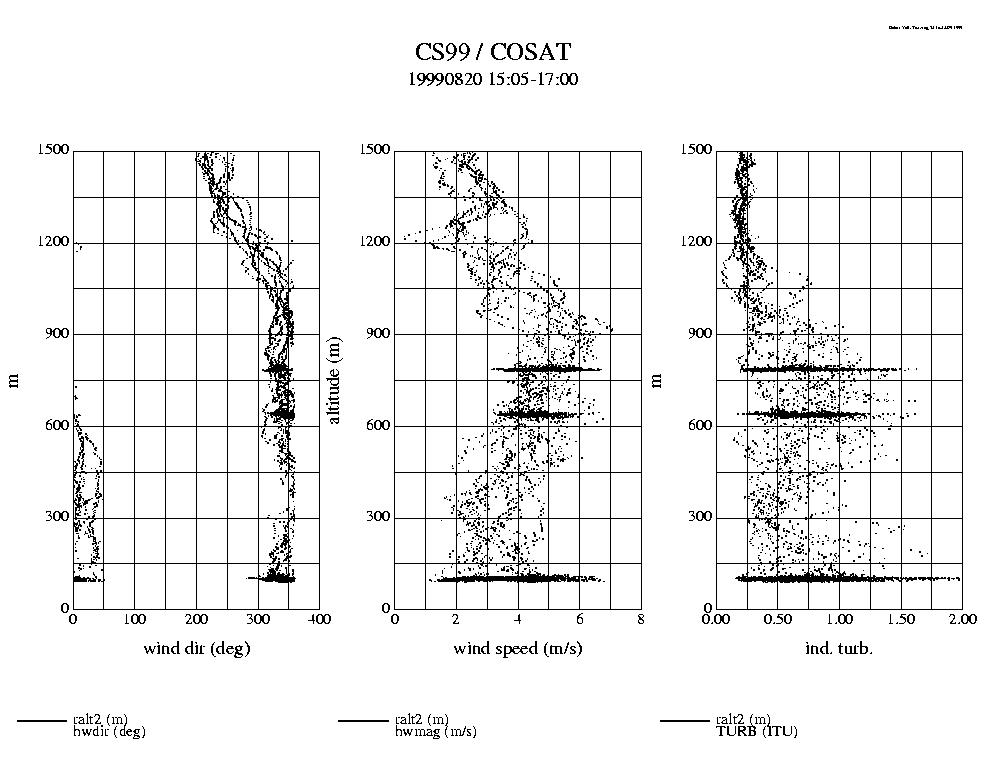
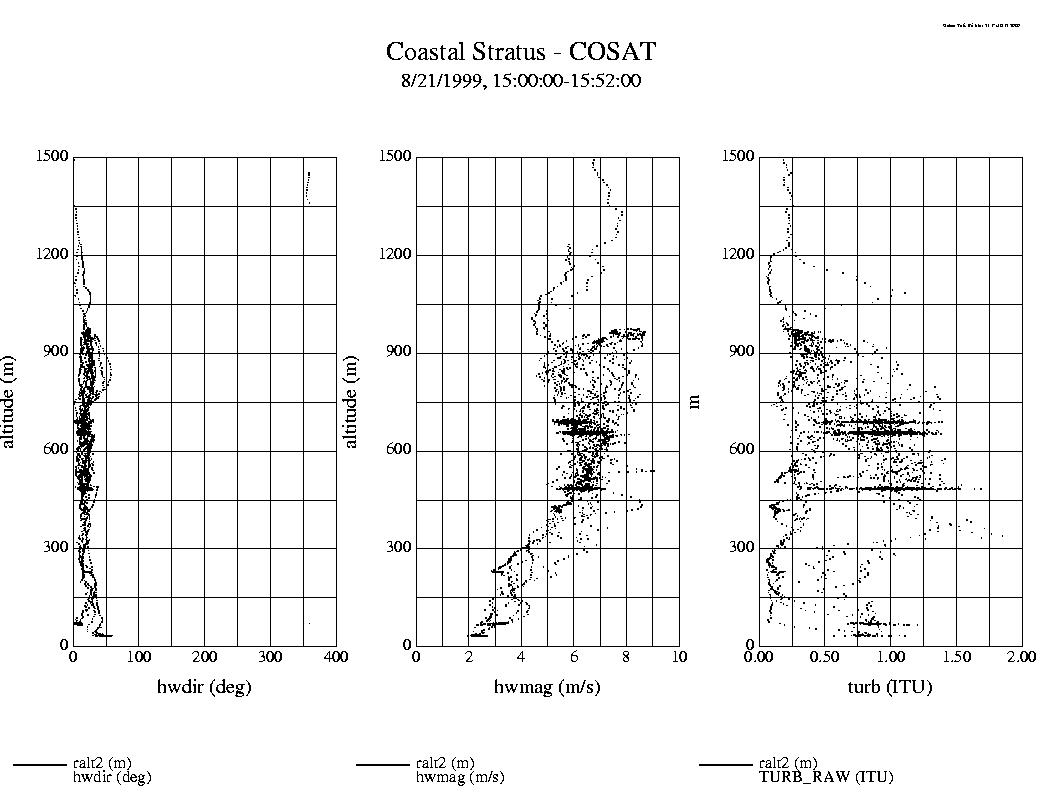
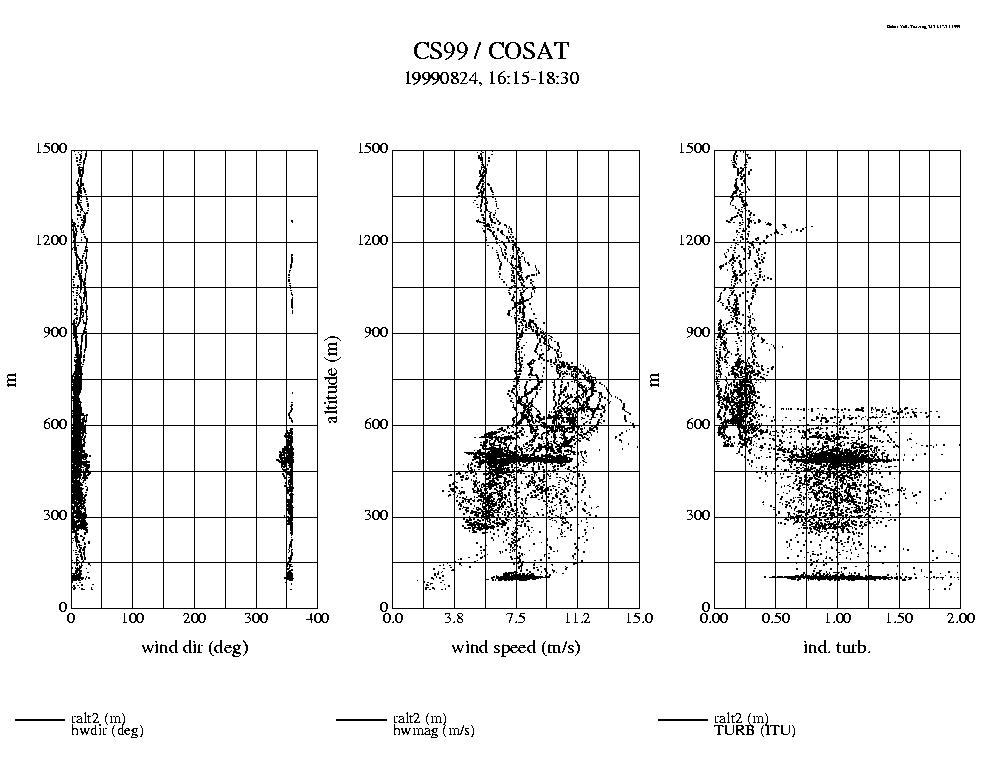
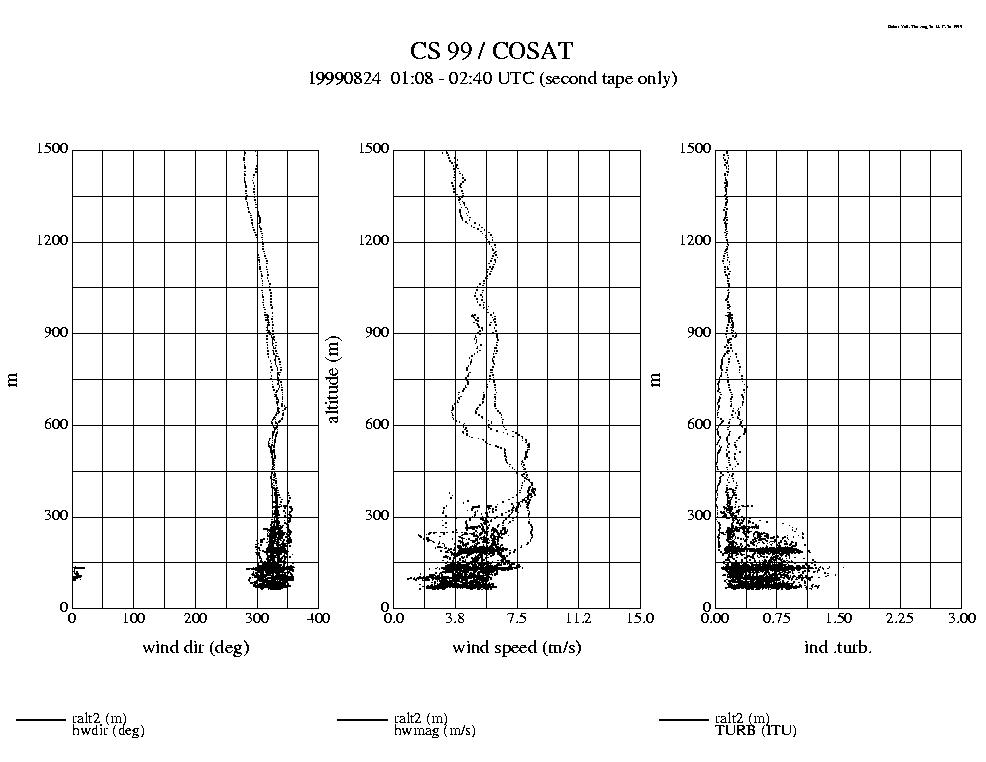
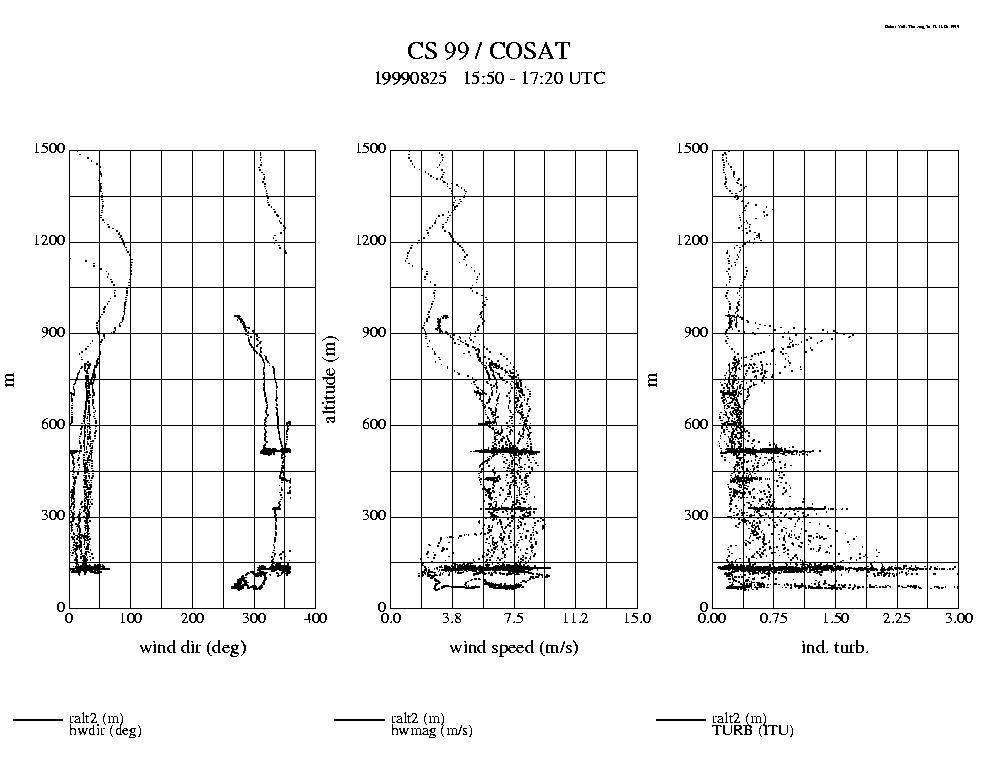
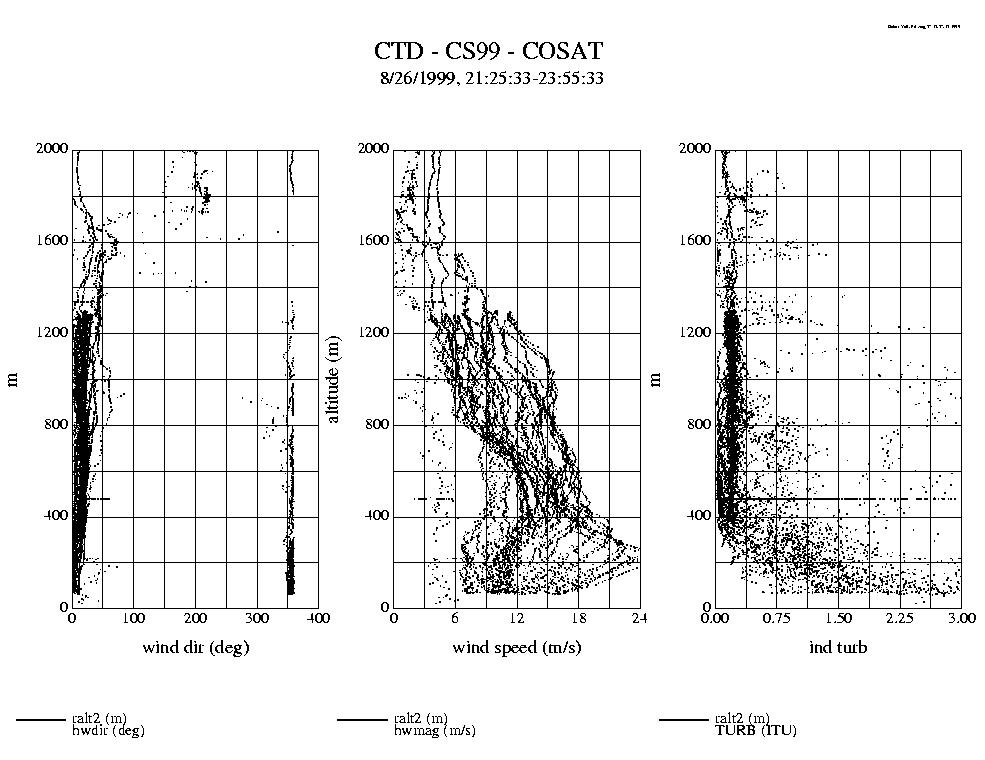
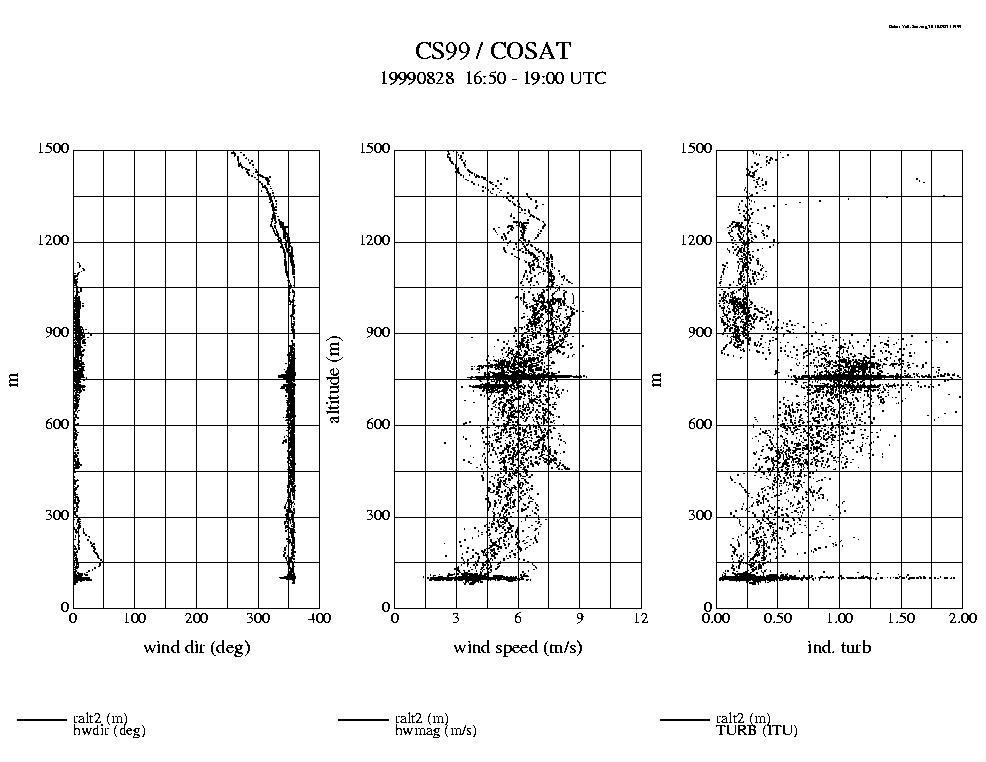
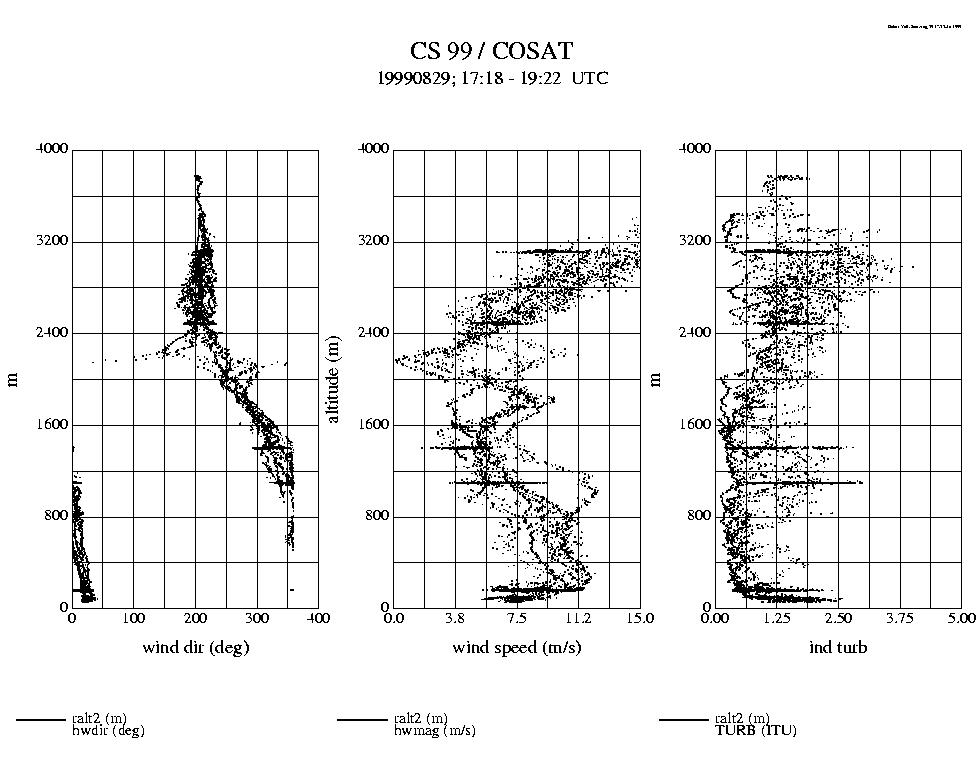
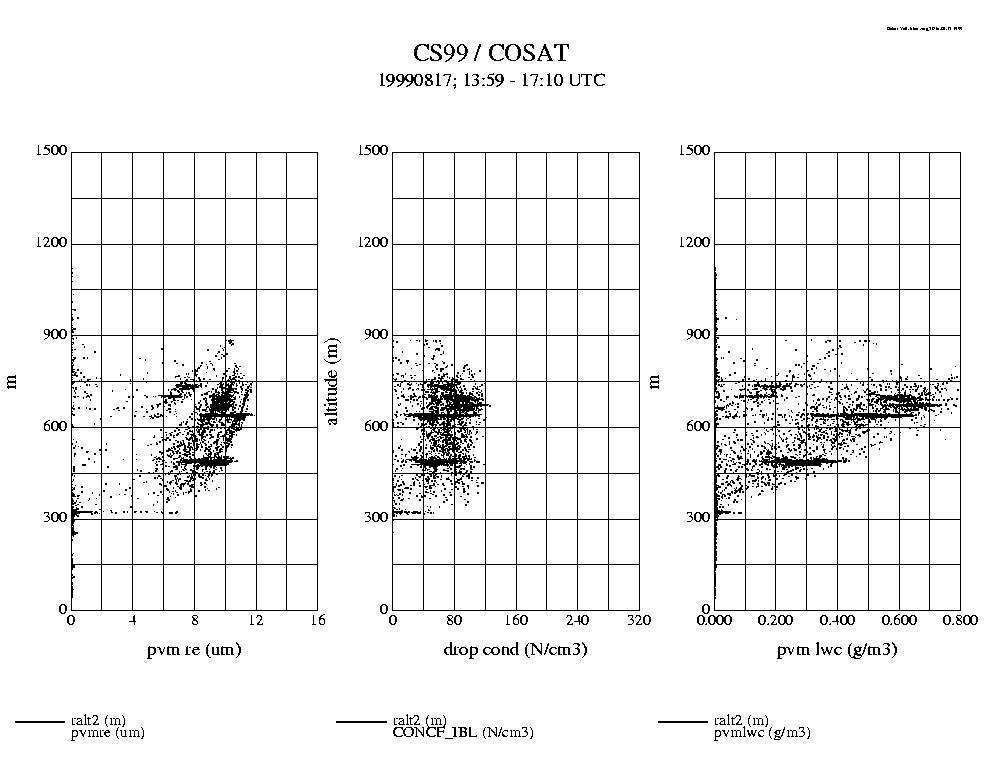
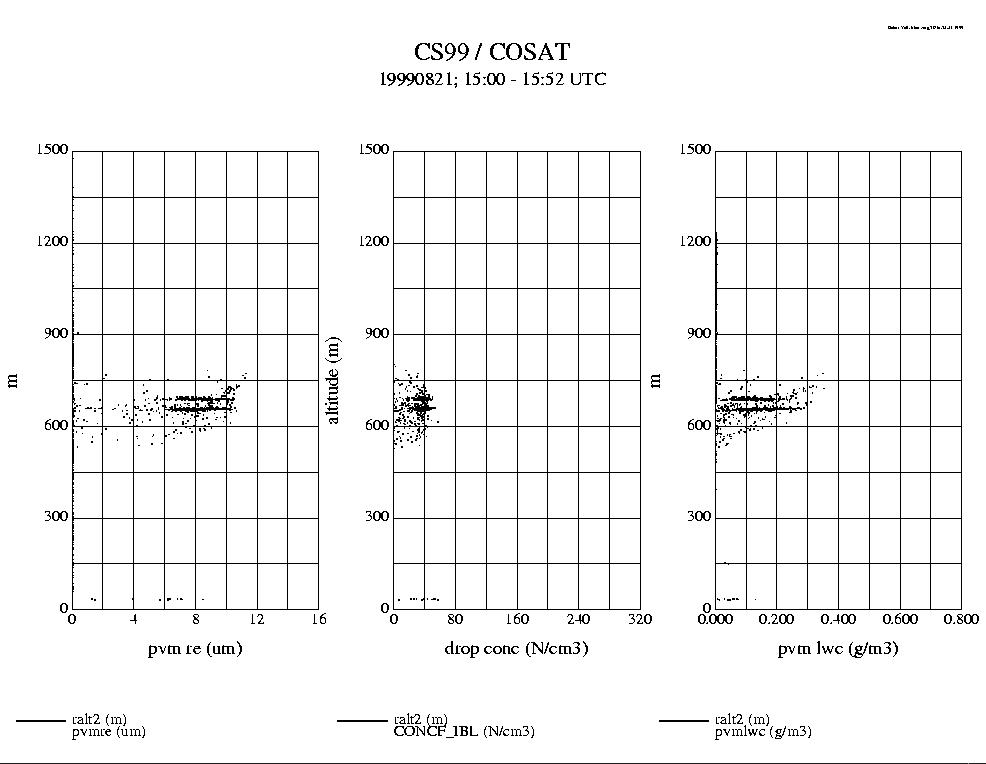
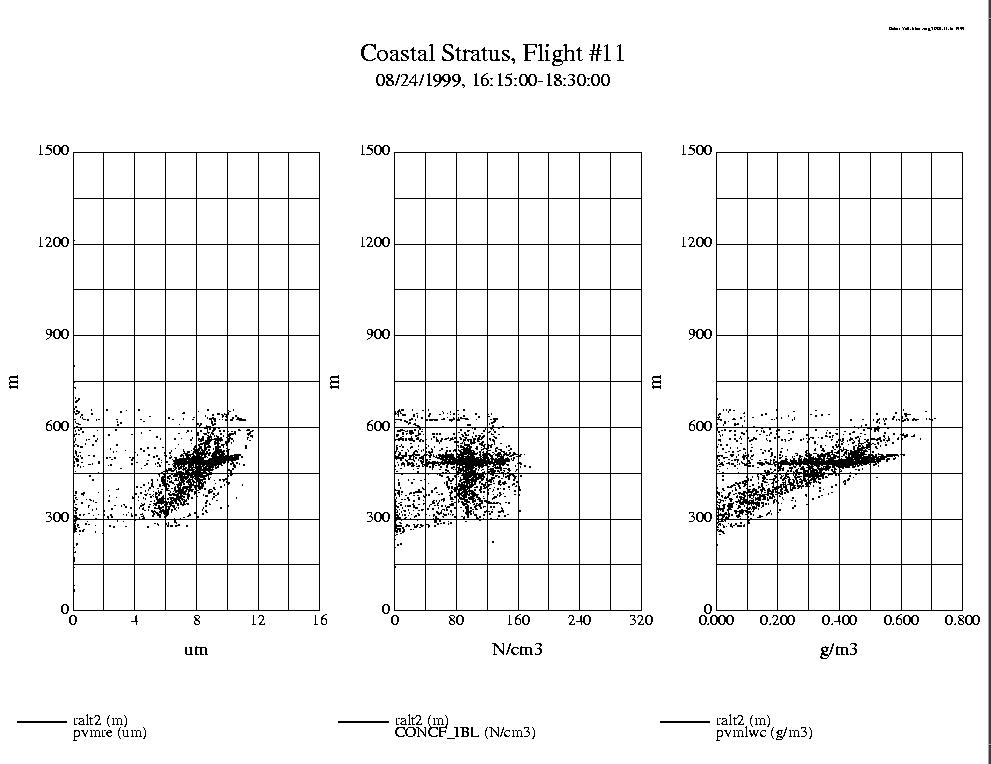
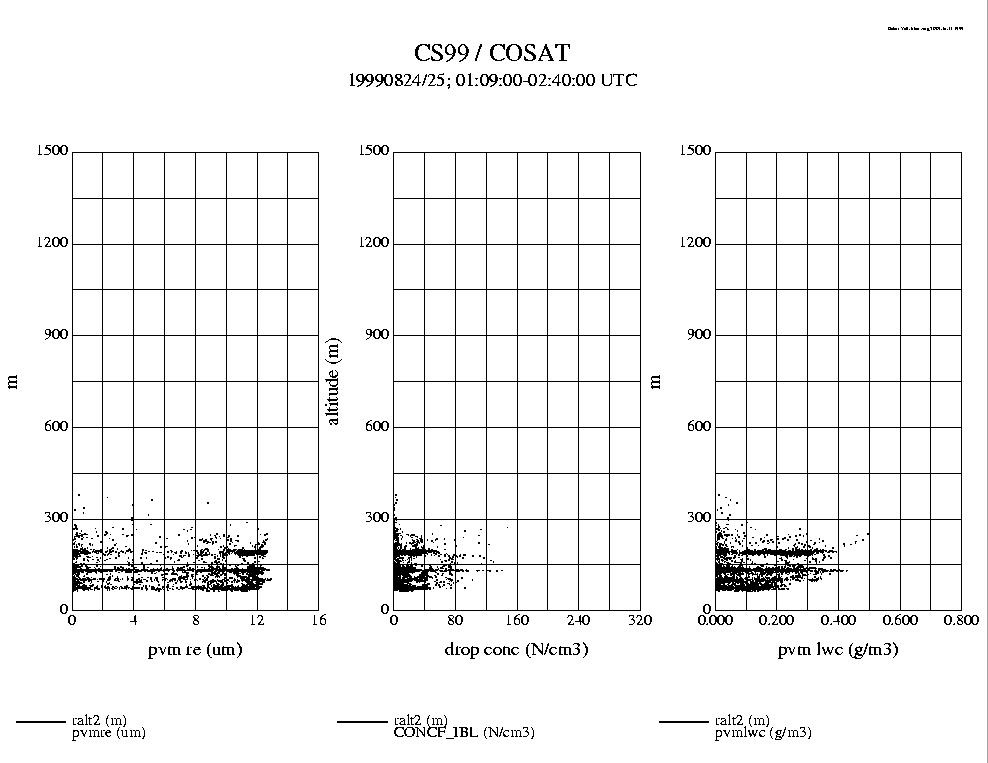
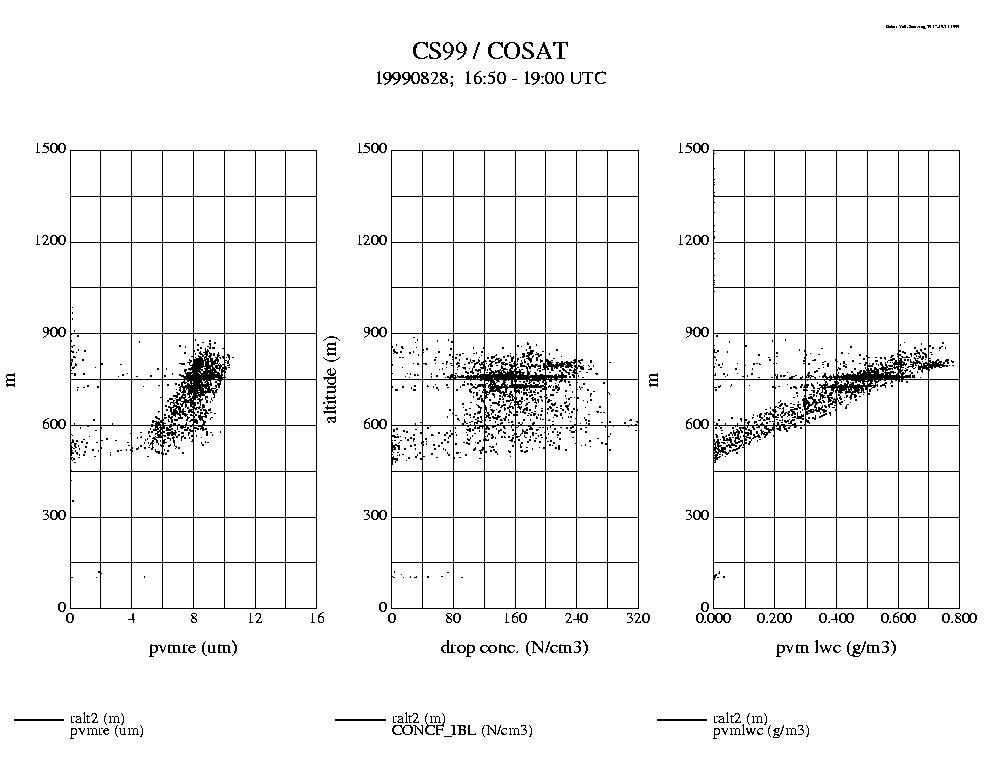
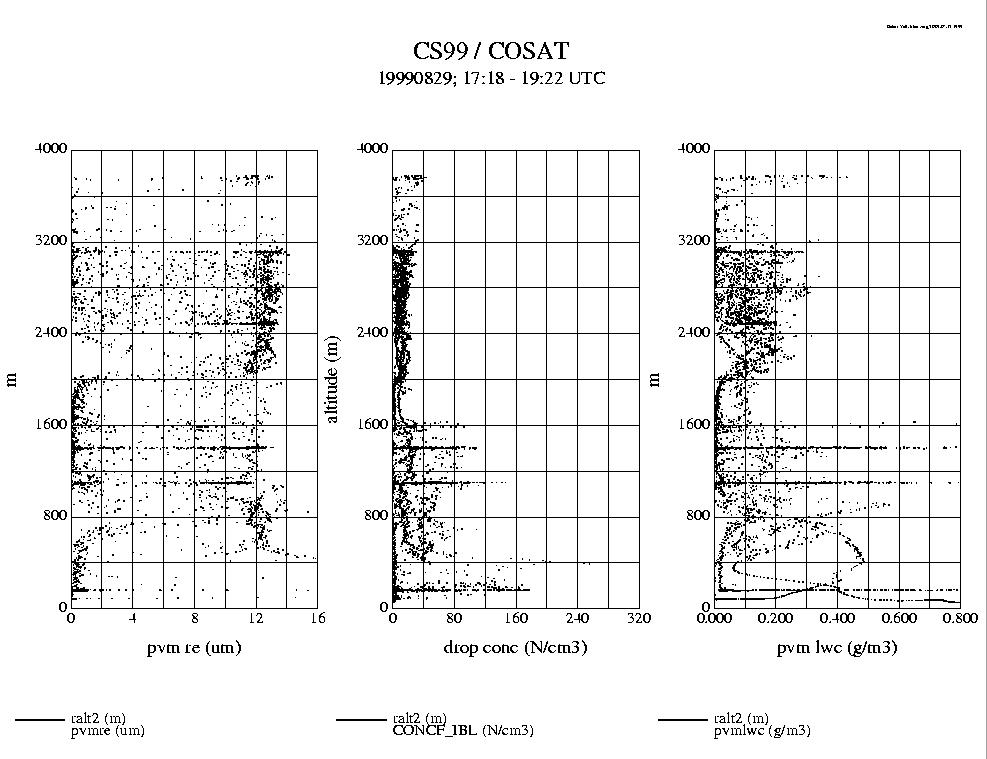
The table below provides links to soundings. The first row, with 't' symbols links to soundings of temperature, dew point and liquid water content. Plots reached via 'w' contain wind speed and direction and turbulence. The 'r' plots contain equivalent radius, droplet concentration and lwc.
The plots (.jpg format) have 1-second values in scatterplot format for the time period indicated on top. These time periods are essentialy the full period of the flight off the coast.
These soundings provide a first look at the general characteristics of the cloud. The variabilities in each parameter reflect the range of observed values within the cloud.
| aug09 | aug10 | aug11 | aug16 | aug17 | aug20 | aug21 | aug24 | aug24c | aug25 | aug26 | aug28 | aug29 |
| t | t | t | t | t | t | t | t | t | t | t | t | t |
| w | w | w | w | w | w | w | w | w | w | w | w | w |
| r | r | r | r | r | r |
Links: